Web Interface
Web tasarımında değişik görsel sayfalar yapmak için video:
https://www.youtube.com/watch?v=0QTzTOJCzLY
Web arayüzü için node-red ten 10x daha performanslı olduğunu iddaa eden yöntem :
Crosser Fog Computing Software
Web Interface - Gauge
Ornek gauge lar
d3js gauge graphsliquidFillGaugeText { font-family: Helvetica; font-weight: bold; } var gauge1 = loadLiquidFillGauge("fillgauge1", 55); var config1 = liquidFillGaugeDefaultSettings(); config1.circleColor = "#FF7777"; config1.textColor = "#FF4444"; config1.waveTextColor = "#FFAAAA"; config1.waveColor = "#FFDDDD"; config1.circleThickness = 0.2; config1.textVertPosition = 0.2; config1.waveAnimateTime = 1000; var gauge2= loadLiquidFillGauge("fillgauge2", 28, config1); var config2 = liquidFillGaugeDefaultSettings(); config2.circleColor = "#D4AB6A"; config2.textColorhttps://embed.plnkr.co/plunk/mPkOsg
 Customizable Gauge Library With JavaScript And Canvas - Gauge.js | CSS ScriptA powerful JavaScript library to render customizable, animated gauges on an HTML5 canvas element.
 https://www.cssscript.com/customizable-gauge-canvas/
Gauge Nasıl yapılır
Responsive Gauge (CSS-Only) - HTML, CSS & JavaScript TutorialLink to source code:https://codepen.io/dcode-software/pen/zYGVXyXIn today's video I'll be showing you how to create a responsive gauge using pure CSS - the o...https://www.youtube.com/watch?v=FnUkVcQ_3CQ
 Chart JS 2 Creating a Gauge ChartIn this video you will explore how to use create a Gauge chart with Chart JS.In the Chart JS documentation it indicates that there is no build in commands fo...
Aşağıdaki linkteki gauge çalıştı, sistem üzerinde şimdilik bunu seçtim. ( 18.02.2021 )
JSFiddleTest your JavaScript, CSS, HTML or CoffeeScript online with JSFiddle code editor. http://jsfiddle.net/Lgbxyrj5/4/
Benim kod:
<!DOCTYPE html>
<html>
<head>
    <meta charset="utf-8">
	<meta name="viewport" content="width=320" />
	<meta name="apple-mobile-web-app-capable" content="yes" />
	<title>Gauge</title>
	<script type="text/javascript" src="myvendor/d3.v2.min.js"></script>


	<style>
		body {
			font-family:  Helvetica, Arial, sans-serif;
			margin: 32px;
		}

		/*---------------------gauge1------------------------*/
		#power-gauge_outVoltL1{
			position: absolute;
			left: 200px;
			top: 100px;
		}
		#power-gauge_outVoltL1 g.arc {
			fill: rgb(26, 110, 179);
		}

		#power-gauge_outVoltL1 g.pointer {
			fill: #1f86c2;
			stroke: #1f86c2;
		}

		#power-gauge_outVoltL1 g.label text {
			text-anchor: middle;
			font-size: 12px;
			font-weight: bold;
			fill: #666;
		}

		/*---------------------gauge2------------------------*/
		#power-gauge_outVoltL2{
			position: absolute;
			left: 400px;
			top: 100px;
		}
		#power-gauge_outVoltL2 g.arc {
			fill: rgb(26, 110, 179);
		}

		#power-gauge_outVoltL2 g.pointer {
			fill: #1f86c2;
			stroke: #1f86c2;
		}

		#power-gauge_outVoltL2 g.label text {
			text-anchor: middle;
			font-size: 12px;
			font-weight: bold;
			fill: #666;
		}

		/*---------------------frame------------------------*/
		.frame {
			width: 1200px;
			height: 620px;
			background: #333333;
			margin: 0px 25px;
			position: relative;
		}
		/*****outVoltL1*****/
		.outVoltL1 {
			color : white;
			position: absolute;
			left: 263px;
			top: 173px;
		}
		.outVoltL1_label {
			color : white;
			position: absolute;
			left: 210px;
			top: 60px;
		}
		.outVoltL1_unit {
			color : white;
			position: absolute;
			left: 270px;
			top: 195px;
		}

		/*****outVoltL2*****/
		.outVoltL2 {
			color : white;
			position: absolute;
			left: 463px;
			top: 173px;
		}
		.outVoltL2_label {
			color : white;
			position: absolute;
			left: 410px;
			top: 60px;
		}
		.outVoltL2_unit {
			color : white;
			position: absolute;
			left: 470px;
			top: 195px;
		}
	</style>
	</head>
	<body>
		<div class="frame" >
			<p class = "outVoltL1_label">Output Voltage L1</p>
			<div id="power-gauge_outVoltL1"></div>
			<p class="outVoltL1"></p>
			<p class="outVoltL1_unit">V</p>


			<p class = "outVoltL2_label">Output Voltage L2</p>
			<div id="power-gauge_outVoltL2"></div>
			<p class="outVoltL2"></p>
			<p class="outVoltL2_unit">V</p>
		</div>

	<script>
	var gauge = function(container, configuration) {
		var that = {};
		var config = {
			size						: 200,
			clipWidth					: 200,
			clipHeight					: 110,
			ringInset					: 20,
			ringWidth					: 20,

			pointerWidth				: 10,
			pointerTailLength			: 5,
			pointerHeadLengthPercent	: 0.7,

			minValue					: 0,
			maxValue					: 10,

			minAngle					: -135,
			maxAngle					: 135,

			transitionMs				: 750,

			majorTicks					: 6,
			labelFormat					: d3.format(',g'),
			labelInset					: 15,

			arcColorFn					: d3.scale.quantize()
									 	  .domain([0, 0.166, 0.332, 0.498, 0.664, 0.830, 1])
										  .range(['#FFCE00','#FFCE00','#42BF8E','#42BF8E','#42BF8E', '#FD606A'])
										  //d3.interpolateHsl(d3.rgb('#e8e2ca'), d3.rgb('#3e6c0a'))
		};
		var range = undefined;
		var r = undefined;
		var pointerHeadLength = undefined;
		var value = 0;

		var svg = undefined;
		var arc = undefined;
		var scale = undefined;
		var ticks = undefined;
		var tickData = undefined;
		var pointer = undefined;

		var donut = d3.layout.pie();

		function deg2rad(deg) {
			return deg * Math.PI / 180;
		}

		function newAngle(d) {
			var ratio = scale(d);
			var newAngle = config.minAngle + (ratio * range);
			return newAngle;
		}

		function configure(configuration) {
			var prop = undefined;
			for ( prop in configuration ) {
				config[prop] = configuration[prop];
			}

			range = config.maxAngle - config.minAngle;
			r = config.size / 2;
			pointerHeadLength = Math.round(r * config.pointerHeadLengthPercent);

			// a linear scale that maps domain values to a percent from 0..1
			scale = d3.scale.linear()
				.range([0,1])
				.domain([config.minValue, config.maxValue]);

			ticks = scale.ticks(config.majorTicks);
			tickData = d3.range(config.majorTicks).map(function() {return 1/config.majorTicks;});

			arc = d3.svg.arc()
				.innerRadius(r - config.ringWidth - config.ringInset)
				.outerRadius(r - config.ringInset)
				.startAngle(function(d, i) {
					var ratio = d * i;
					return deg2rad(config.minAngle + (ratio * range));
				})
				.endAngle(function(d, i) {
					var ratio = d * (i+1);
					return deg2rad(config.minAngle + (ratio * range));
				});
		}
		that.configure = configure;

		function centerTranslation() {
			return 'translate('+r +','+ r +')';
		}

		function isRendered() {
			return (svg !== undefined);
		}
		that.isRendered = isRendered;

		function render(newValue) {
			svg = d3.select(container)
				.append('svg:svg')
					.attr('class', 'gauge')
					.attr('width', config.clipWidth)
					.attr('height', config.clipHeight);

			var centerTx = centerTranslation();

			var arcs = svg.append('g')
					.attr('class', 'arc')
					.attr('transform', centerTx);

			arcs.selectAll('path')
					.data(tickData)
				.enter().append('path')
					.attr('fill', function(d, i) {
						return config.arcColorFn(d * i);
					})
					.attr('d', arc);

			var lg = svg.append('g')
					.attr('class', 'label')
					.attr('transform', centerTx);
			lg.selectAll('text')
					.data(ticks)
				.enter().append('text')
					.attr('transform', function(d) {
						var ratio = scale(d);
						var newAngle = config.minAngle + (ratio * range);
						return 'rotate(' +newAngle +') translate(0,' +(config.labelInset - r) +')';
					})
					.text(config.labelFormat);

			var lineData = [ [config.pointerWidth / 2, 0],
							[0, -pointerHeadLength],
							[-(config.pointerWidth / 2), 0],
							[0, config.pointerTailLength],
							[config.pointerWidth / 2, 0] ];
			var pointerLine = d3.svg.line().interpolate('monotone');
			var pg = svg.append('g').data([lineData])
					.attr('class', 'pointer')
					.attr('transform', centerTx);

			pointer = pg.append('path')
				.attr('d', pointerLine/*function(d) { return pointerLine(d) +'Z';}*/ )
				.attr('transform', 'rotate(' +config.minAngle +')');

			update(newValue === undefined ? 0 : newValue);
		}
		that.render = render;

		function update(newValue, newConfiguration) {
			if ( newConfiguration  !== undefined) {
				configure(newConfiguration);
			}
			var ratio = scale(newValue);
			var newAngle = config.minAngle + (ratio * range);
			pointer.transition()
				.duration(config.transitionMs)
				.ease('elastic')
				.attr('transform', 'rotate(' +newAngle +')');
		}
		that.update = update;

		configure(configuration);

		return that;
	};
	</script>


	<script src="vendor/jquery/jquery.min.js"></script>
	<script type="text/javascript">

		var outVoltL1 = 100;
		var outVoltL2 = 100;

		$(document).ready(
		function myFunction()
		{
			setInterval
			(
				function()
				{
					$(".hiddenInput").load("sharedDatas.php");
					var obj = JSON.parse(document.getElementsByClassName('hiddenInput')[0].innerText);

					outVoltL1 = obj.outVoltL1;
					outVoltL2 = obj.outVoltL2;
					document.getElementsByClassName('outVoltL1')[0].innerHTML = obj.outVoltL1;
					document.getElementsByClassName('outVoltL2')[0].innerHTML = obj.outVoltL2;
					document.getElementsByClassName('outVoltL3')[0].innerHTML = obj.outVoltL3;


				} , 250
			);
		});

		//gauge code
		function onDocumentReady() {
			var powerGauge_outVoltL1 = gauge('#power-gauge_outVoltL1', {
				size: 150,
				clipWidth: 150,
				clipHeight: 150,
				ringWidth: 20,
				maxValue: 300,
				transitionMs: 4000,
			});
			powerGauge_outVoltL1.render();

			var powerGauge_outVoltL2 = gauge('#power-gauge_outVoltL2', {
				size: 150,
				clipWidth: 150,
				clipHeight: 150,
				ringWidth: 20,
				maxValue: 300,
				transitionMs: 4000,
			});
			powerGauge_outVoltL2.render();

			function updateReadings() {
				// just pump in random data here...
				powerGauge_outVoltL1.update(outVoltL1);
				powerGauge_outVoltL2.update(outVoltL2);
			}

			// every few seconds update reading values
			updateReadings();
			setInterval(function() {
				updateReadings();
			}, 1 * 250);

	}
	if ( !window.isLoaded ) {
		window.addEventListener("load", function() {
			onDocumentReady();
		}, false);
	} else {
		onDocumentReady();
	}

	</script>


    <input class="hiddenInput" type="hidden" value="0">

</body>
</html>
Web Interface - Animation line with svg
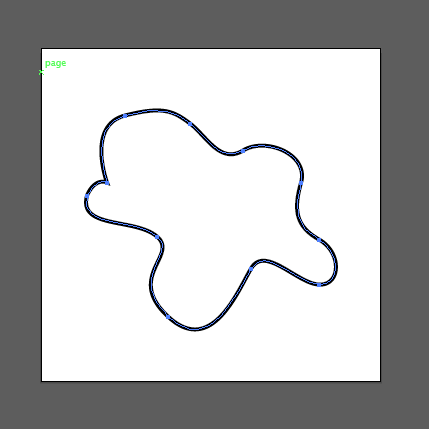
How SVG Line Animation Works | CSS-TricksI bet all of you have seen that little trick where an SVG path is animated to look like it's drawing itself. It's super cool. Jake Archibald pioneered the technique and has a super good interactive blog post on how it works. Brian Suda wrote about it on 24 Ways.https://css-tricks.com/svg-line-animation-works/
 An SVG Primer for Today's BrowsersScalable Vector Graphics (SVG) is a Web graphics language. SVG defines markup and APIs for creating static or dynamic images, capable of interactivity and animation, including various graphical effects. It can be styled with CSS, and combined with HTML. This document provides an introduction to SVG, with examples and explanations.
https://www.w3.org/Graphics/SVG/IG/resources/svgprimer.html#path_C
InkscapeIf your Ubuntu version or derivative has not packaged Inkscape 1.0.2 for you yet, you can install the current version from our ppa for Ubuntu 18.04, 20.04, 20.10 and 21.04: sudo add-apt-repository ppa:inkscape.dev/stable sudo apt update sudo apt install inkscape Inkscape needs your help. https://inkscape.org/release/inkscape-1.0.2/gnulinux/ubuntu/ppa/dl/Border Animation in CSS and JavaScriptBlog, Gaoping Huang
https://gaopinghuang0.github.io/2019/01/01/border-animation
Animation of a svg path with "animation: dash 5s linear alternate infinite;" not working only in FirefoxThanks for contributing an answer to Stack Overflow! Please be sure to answer the question. Provide details and share your research! Asking for help, clarification, or responding to other answers. Making statements based on opinion; back them up with references or personal experience. To learn more, see our tips on writing great answers.https://stackoverflow.com/questions/62849189/animation-of-a-svg-path-with-animation-dash-5s-linear-alternate-infinite-not
 30 Awesome SVG Animation For Your Inspiration - HongkiatDesigners used to create animations in HTML elements using CSS. However, due to the limitations of HTML elements in creating patterns, shapes, and others,
 https://www.hongkiat.com/blog/svg-animations/